Image Details
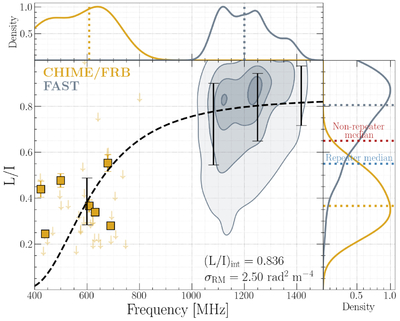
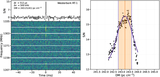
Caption: Figure 3.
Linear polarization fraction vs. central frequency of FRB 20220529A bursts reported by CHIME/FRB and FAST. Polarized bursts observed by CHIME/FRB are plotted as gold squares, and L/I upper limits are shown as downward arrows. The large quantity of FAST observations is depicted as a gray density map with increasing opacity at discrete contour levels of 5%, 33%, 67%, and 95%, for visual clarity. Bursts during the RM excursion have been removed from the FAST data. The best-fit model is overplotted as a black dashed line, and the fit parameters are presented in the bottom right of the main panel. The binned L/I data on which the depolarization model was fit are plotted as vertical black bars centered on the mean binned values and spanning their standard deviations. Upper limits on L/I are not used in the depolarization model fitting. Smoothed kernel density estimates of the central frequency and L/I distributions for polarized bursts observed by each instrument are plotted in gold and gray, respectively, above and to the right of the main panel. Gold and gray dotted lines in these panels represent the medians of the corresponding distributions. Median L/I for polarized CHIME/FRB repeaters (C. Ng et al. 2025) and nonrepeaters (A. Pandhi et al. 2024) are overplotted as blue and red dotted lines, respectively, in the right-most panel.
Other Images in This Article
Copyright and Terms & Conditions
© 2026. The Author(s). Published by the American Astronomical Society.