Image Details
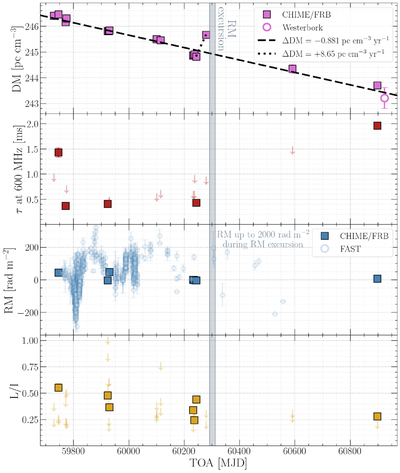
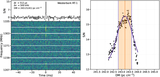
Caption: Figure 2.
Temporal evolution of the DM, τ, RM, and L/I in FRB 20220529A as seen by CHIME/FRB (squares). Uncertainties in these parameters are smaller than the markers. The “RM excursion” (Y. Li et al. 2026) is shaded in gray. In the top panel, the best-fit decline in linear DM is plotted as a dashed line, and the slope of the rise in DM preceding the RM excursion is depicted with a dotted line. The DM of a burst detected by the RT-1 Westerbork radio telescope is plotted as an open purple circle. In the second and the bottom panels, upper limits on τ and L/I, respectively, are plotted as downward arrows. To show how the CHIME/FRB RMs fit into the broader RM evolution of FRB 20220529A, we overplot the FAST RM measurements by Y. Li et al. (2026) as blue open circles in the third panel; the RM excursion peak falls outside the y-axis range in this panel.
Other Images in This Article
Copyright and Terms & Conditions
© 2026. The Author(s). Published by the American Astronomical Society.