Image Details
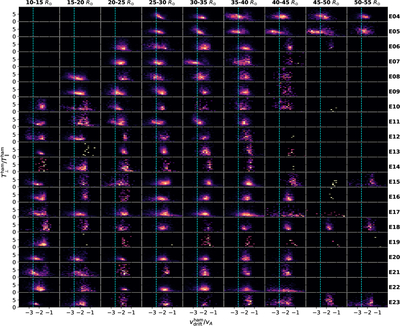
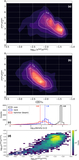
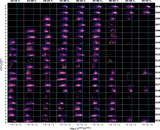
Caption: Figure 9.
Characterization of the hammerhead population detected using hampy from E04 through E23 using trends of ﹩{T}_{\perp }^{{\rm{ham}}}/{T}_{\parallel }^{{\rm{ham}}}﹩ versus the fractional drift velocity of hammer with respect to the core normalized by the Alfvén speed vA. The hammerhead detections have been separated into nine radial distance bins for each encounter. Added for visual reference, the cyan vertical line indicates the fractional density reported by V22, who presented the same trends for a 7 hr period on 2020 January 29 during E04. The color scale is linear, and each panel’s histogram is normalized to have an area under the 2D map of 1, for better visibility.
Other Images in This Article
Copyright and Terms & Conditions
© 2026. The Author(s). Published by the American Astronomical Society.