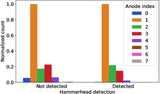
Image Details
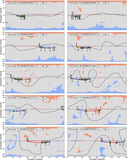
Caption: Figure 1.
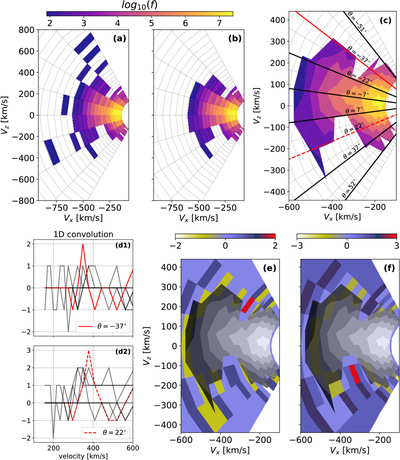
Schematic summary of our hammerhead detection algorithm used in hampy. All velocity phase-space plots are presented on an E − θ plane. The Vx − Vz coordinates are calculated by using ϕ ∼ 163﹩\mathop{.}\limits^{\unicode{x000b0}}﹩125. (a) ϕ-collapsed f(vx, vz) in the SPAN-I instrument frame before preprocessing. (b) f(vx, vz) after removing spurious count bins that do not form a contiguous distribution in the 2D (vx, vz) space. (c) The same as panel (b) but plotted using contour levels in a cell-centered convention. The black lines represent slices along different instrument elevation angles. The red lines at θ ∼ −37° and 22° correspond to the elevations for the detected necks for the shown hammerhead distribution. The red grids in panels (e) and (f) show the detected necks using the corresponding 1D convolution profiles shown in panels (d1) and (d2). All VDF values are presented in log base 10.
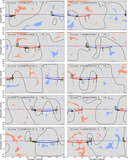
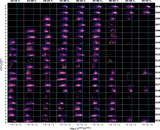
Other Images in This Article
Copyright and Terms & Conditions
© 2026. The Author(s). Published by the American Astronomical Society.