Image Details
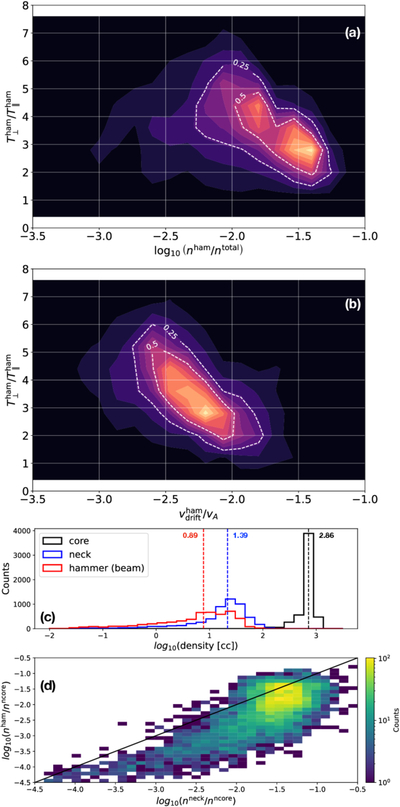
Caption: Figure 4.
Characterizing hammerheads flagged by hampy to compare trends of the temperature anisotropy of the hammer ﹩{T}_{\perp }^{{\rm{ham}}}/{T}_{\parallel }^{{\rm{ham}}}﹩ versus (a) the fractional density nham/ntotal and (b) the normalized drift speed ﹩{v}_{{\rm{drift}}}^{{\rm{ham}}}/{v}_{{\rm{A}}}﹩. The 2D histograms are normalized to a maximum value of 1. The white dashed lines represent the 50th and 25th quantiles. The hammerheads are chosen from E04 within the radial distance bin 25−30R⊙ as a comparison against the result reported V22. Panel (c) shows 1D histograms for the densities of the core, neck, and hammer components, while panel (d) shows a 2D histogram for the fractional neck versus the fractional hammer densities (both normalized with respect to the core). The vertical dashed black, blue, and red lines in panel (c) show the statistical mean of the histograms for the core, neck, and hammer, respectively. The solid black line in panel (d) denotes an x = y line.
Other Images in This Article
Copyright and Terms & Conditions
© 2026. The Author(s). Published by the American Astronomical Society.