Image Details
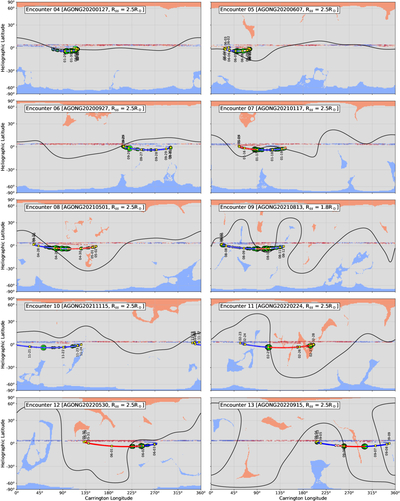
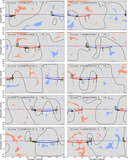
Caption: Figure 6.
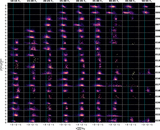
The same as Figure 3, showing: (a) the PSP trajectory colored by r2BR(r) (red indicates positive polarity and blue indicates negative polarity); (b) the hammerhead occurrence fraction nham/ntotal proportional to the size of the lime green circles centered at each 1° bin along the PSP trajectory; and (c) the modeled HCS in solid black from E04–E13. The orange (blue) shaded regions indicate coronal holes formed by radially outgoing (incoming) open magnetic field lines.
Other Images in This Article
Copyright and Terms & Conditions
© 2026. The Author(s). Published by the American Astronomical Society.
Copyright ©
2026 Astronomy Image Explorer. All Rights Reserved.