Image Details
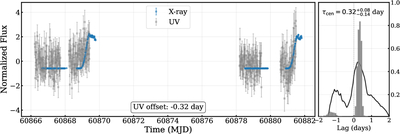
Caption: Figure A2.
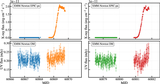
The left panel shows the XMM-Newton X-ray and UV light curves, with the UV data shifted by the measured centroid lag of 0.32 day, while the right panel shows the lag posterior distribution and the corresponding CCF. X-ray and UV light curves are normalized to zero mean and unit variance; errors are scaled accordingly.
Other Images in This Article
Copyright and Terms & Conditions
© 2026. The Author(s). Published by the American Astronomical Society.
Copyright ©
2026 Astronomy Image Explorer. All Rights Reserved.