Image Details
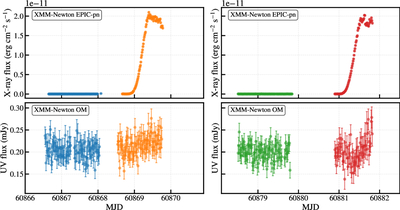
Caption: Figure A1.
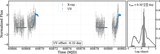
XMM-Newton EPIC-pn (0.2–10 keV) X-ray (top) and OM UVW2 UV (bottom) light curves showing two flare episodes. Different colors correspond to four XMM observations (OBSIDs 064540101-0964540401).
Other Images in This Article
Copyright and Terms & Conditions
© 2026. The Author(s). Published by the American Astronomical Society.
Copyright ©
2026 Astronomy Image Explorer. All Rights Reserved.