Image Details
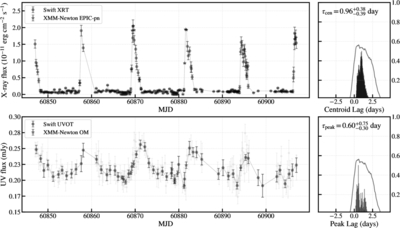
Caption: Figure 2.
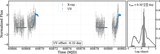
Correlation between the soft X-ray (0.3–2 keV) and UV light curves of Ansky. Left panels: the X-ray light curves are obtained from Swift XRT and XMM-Newton EPIC-pn, while the UVW2 light curves are from Swift UVOT and XMM-Newton OM. The XMM-Newton data are binned to 0.2 days to match the Swift cadence (original data shown in Figure A1). The original Swift UV data and the 0.2 day binned XMM-Newton data are used for lag measurements (light gray); both are additionally binned to 1 day for clarity. Right panels: cross-correlation results show the centroid lag (top), peak-lag distribution (bottom), and the corresponding CCF and lag posterior distributions. The maximum correlation coefficient is ﹩{r}_{{\rm{\max }}}=0.56\pm 0.04﹩.
Other Images in This Article
Copyright and Terms & Conditions
© 2026. The Author(s). Published by the American Astronomical Society.