Image Details
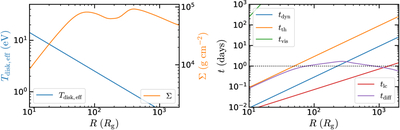
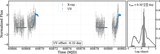
Caption: Figure 3.
Disk profiles (left panel) and different related timescales for the thin-disk model (right panel). The blue line in the left panel shows the disk effective temperature (Tdisk,eff), and the orange line represents the disk surface density Σ with an SMBH mass of MBH = 5 × 10⁶M⊙, disk viscosity α = 0.1, and accretion rate ﹩\dot{m}=0.03﹩. Lines of different colors in the right panel represent the dynamical, thermal, viscous, light-crossing, and diffusion timescales calculated using the same set of parameters. The observed delay time ∼1 day is shown as the dotted line in the bottom panel.
Other Images in This Article
Copyright and Terms & Conditions
© 2026. The Author(s). Published by the American Astronomical Society.
Copyright ©
2026 Astronomy Image Explorer. All Rights Reserved.