Image Details
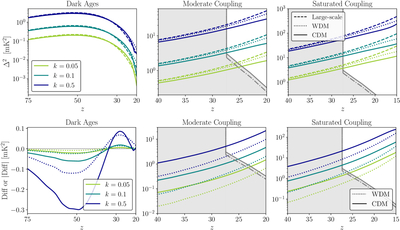
Caption: Figure 2.
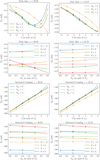
Top panels: the 21 cm power spectrum as a function of z at k = 0.05, 0.1, and 0.5 Mpc−1. We show the same models and cases as in Figure 1: CDM (solid), WDM-like (dotted), and large-scale (dashed), for Dark Ages, moderate coupling, and saturated coupling. Bottom panels: the difference “Diff” in Δ2 due to clumping. Panels with coupling show ∣−Diff∣, and also show the k = 0.05 Mpc−1 sensitivity for SKA AA⋆ (solid gray line and the corresponding shaded area) and SKA AA4 (dotted–dashed gray line).
Other Images in This Article
Copyright and Terms & Conditions
© 2026. The Author(s). Published by the American Astronomical Society.
Copyright ©
2026 Astronomy Image Explorer. All Rights Reserved.