Image Details
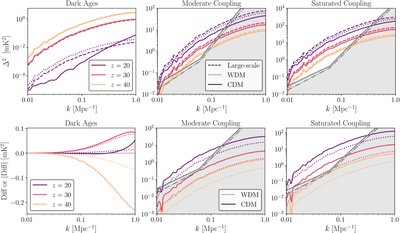
Caption: Figure 1.
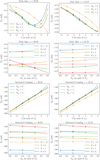
Top panels: the 21 cm power spectrum as a function of k, for the CDM model (solid), WDM-like model with kcut = 100h Mpc−1 (dotted), and large-scale fluctuations only (dashed). We consider the Dark Ages, as well as the Lyα coupling cases of moderate coupling and saturated coupling, each at z = 20, 30, or 40. Bottom panels: the difference “Diff” in Δ2 due to clumping (i.e., between a given model and the case of large-scale fluctuations only), as a function of k. Panels with coupling show ∣Diff∣; those panels also show the z = 20 sensitivity for SKA AA⋆ (solid gray line and the corresponding shaded area) and SKA AA4 (dotted–dashed gray line). We note that the precise output redshifts that we use from the numerical simulations are 19.46, 30.00, and 39.89 (which we loosely refer to as 20, 30, and 40).
Other Images in This Article
Copyright and Terms & Conditions
© 2026. The Author(s). Published by the American Astronomical Society.