Image Details
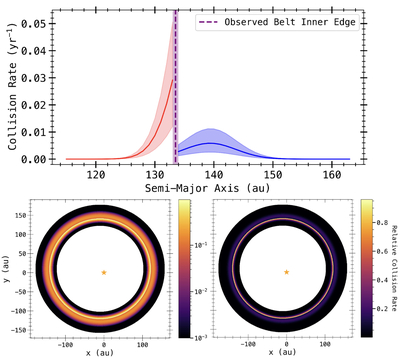
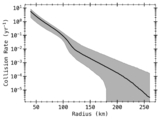
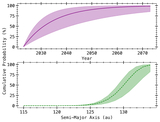
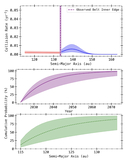
Caption: Figure 6.
Top: the catastrophic collision rate for target planetesimals ≥100 km in radius as a function of belt semimajor axis. The blue region indicates the observed Fomalhaut main belt, and the red region indicates the region where Fomalhaut cs1 and cs2 originated, which is within the observed belt inner edge. We find the highest collision rate at the observed inner edge of the Fomalhaut main belt. The shaded regions indicate the 16th and 84th percentiles of the posterior distribution. We find a very low collision rate interior to 125 au owing to the low surface density of planetesimals in that region. We find a nonnegligible collision rate in the observed main-belt region. Bottom: belt schematics outlining the relative collision rate for target planetesimals ≥100 km in radius. The two images plot the same data, with the left panel showing a logarithmic scale and the right panel showing a linear scale. The brightest band in both images is the location of the observed belt inner edge and the location where the collision rate peaks. This is coincident with the discovery location of the most recent collision, Fomalhaut cs2.
Other Images in This Article
Copyright and Terms & Conditions
© 2026. The Author(s). Published by the American Astronomical Society.