Image Details
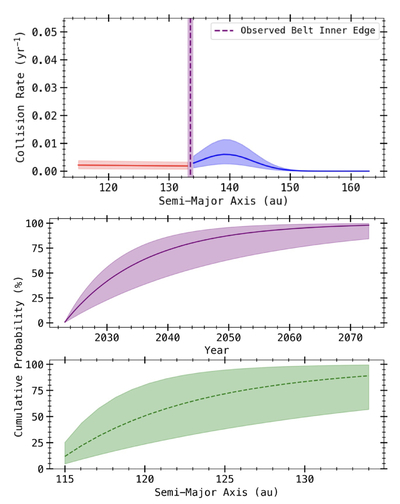
Caption: Figure 11.
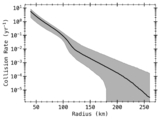
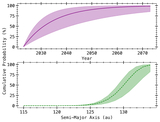
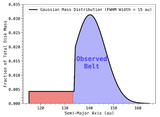
Top: the catastrophic collision rate for target planetesimals ≥100 km in radius and a smoothed/plateau surface density distribution as a function of belt semimajor axis. The blue region indicates the observed Fomalhaut main belt, and the red region indicates the region where Fomalhaut cs1 and cs2 originated, which is within the observed belt inner edge. Middle: the cumulative probability of the next collision event (a hypothetical Fomalhaut cs3) where the target planetesimal is ≥100 km in radius and a smoothed/plateau surface density distribution as a function of collision year. The shaded regions indicate the 16th and 84th percentiles of the posterior distribution. We find a 50% chance of the next collision occurring in 2027 at the earliest and 2041 at the latest. Bottom: the cumulative probability of the next collision event (Fomalhaut cs3) where the target planetesimal is ≥100 km in radius and a smoothed/plateau surface density distribution as a function of belt semimajor axis.
Other Images in This Article
Copyright and Terms & Conditions
© 2026. The Author(s). Published by the American Astronomical Society.