Image Details
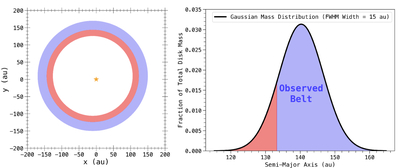
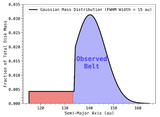
Caption: Figure 1.
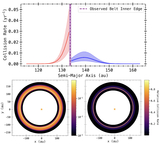
Left: a schematic of the Fomalhaut main belt under our model. The blue region indicates the observed main belt, while the red region contains the low surface density, dynamically hot component of the main belt. Right: the fraction of the belt mass in each region of the disk as a function of belt semimajor axis, which is governed by a Gaussian surface density distribution.
Other Images in This Article
Copyright and Terms & Conditions
© 2026. The Author(s). Published by the American Astronomical Society.
Copyright ©
2026 Astronomy Image Explorer. All Rights Reserved.