Image Details
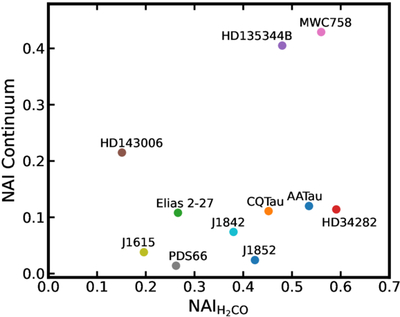
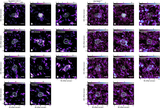
Caption: Figure 6.
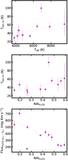
Comparison between the NAI calculated from the 0.8 dust mm continuum emission in exoALMA (P. Curone et al. 2025), and the one calculated from the peak intensity emission maps of the H2CO 4(0,4)–3(0,3) line. There is no clear correlation between the two indices.
Other Images in This Article
Show More
Copyright and Terms & Conditions
© 2026. The Author(s). Published by the American Astronomical Society.
Copyright ©
2026 Astronomy Image Explorer. All Rights Reserved.