Image Details
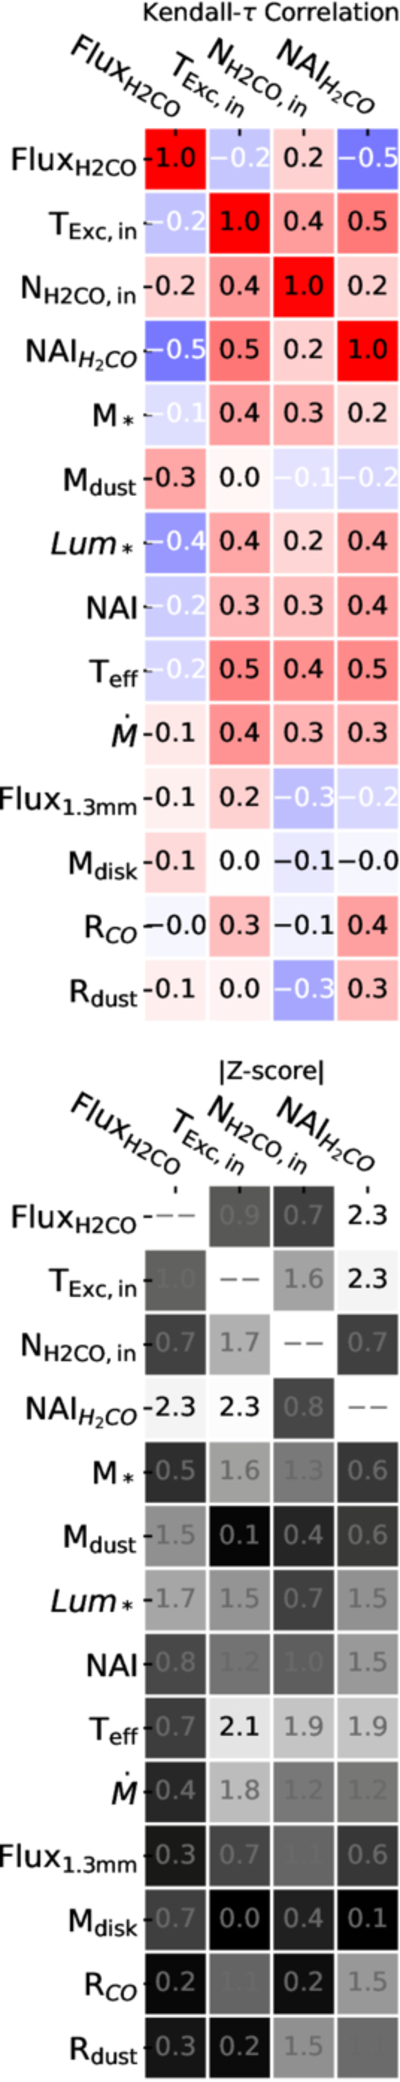
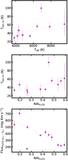
Caption: Figure 4.
Top: weighted Kendall-τ correlation values between compared parameters/metrics, with redder more positively correlated and bluer more anticorrelated pairs. For correlation purposes, the 1.3 mm continuum flux and the line emission flux were normalized to a 100 pc distance for every disk. Bottom: Z-scores of the compared parameters and metrics representing the level of statistical significance of the weighted Kendall-τ correlation values.
Other Images in This Article
Show More
Copyright and Terms & Conditions
© 2026. The Author(s). Published by the American Astronomical Society.
Copyright ©
2026 Astronomy Image Explorer. All Rights Reserved.