Image Details
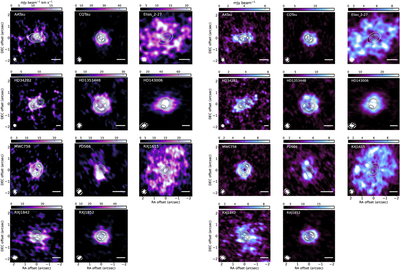
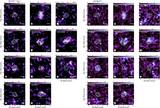
Caption: Figure 1.
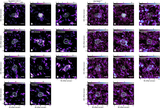
Left: integrated emission maps of the H2CO 4(0,4)–3(0,3) line for the observed sources. Right: peak intensity emission for the same line. Continuum emission at 0.8 mm contours is overlaid to compare with the formaldehyde emission in the disks. Beams are illustrated on the bottom-right with solid white for continuum images and dashed lines for line emission. The bottom-left bar represents a respective 100 au physical scale for each source. For most disks, there are no clear correspondences between the dust continuum contours and the integrated maps.
Other Images in This Article
Show More
Copyright and Terms & Conditions
© 2026. The Author(s). Published by the American Astronomical Society.
Copyright ©
2026 Astronomy Image Explorer. All Rights Reserved.