Image Details
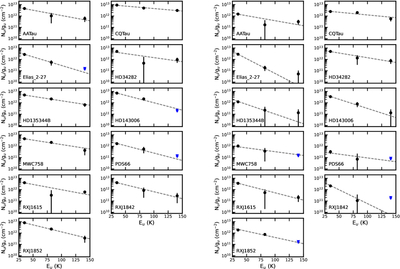
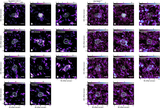
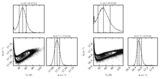
Caption: Figure 2.
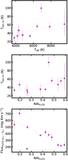
Rotational diagrams of the 11 targeted disks for the inner 100 au (left) and 100–200 au region (right). Blue triangles represent upper limits for undetected transitions, and the dotted lines show the best MCMC fit. In AA Tau, HD 34282, MWC 758, and RX J1615, it is possible that there is more than one emitting component.
Other Images in This Article
Show More
Copyright and Terms & Conditions
© 2026. The Author(s). Published by the American Astronomical Society.
Copyright ©
2026 Astronomy Image Explorer. All Rights Reserved.