Image Details
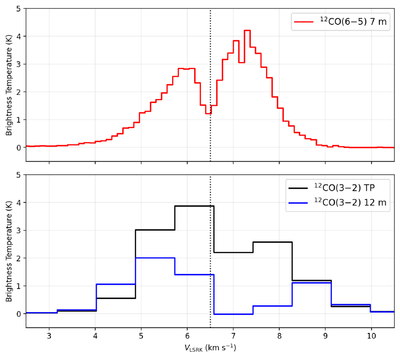
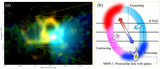
Caption: Figure 1.
Top: mean CO(J = 6–5) spectra extracted from a circular aperture of radius 5″ centered at (ICRS) ﹩\alpha =0{4}^{{\rm{h}}}2{8}^{{\rm{m}}}39\mathop{.}\limits^{{\rm{s}}}97﹩, ﹩\delta =+26^\circ 5{1}^{{\prime} }21\mathop{.}\limits{^{\prime\prime} }5﹩. The systemic velocity of the core, Vsys = 6.5 km s−1, is indicated by the vertical dotted line. Bottom: mean CO(J = 3–2) spectrum obtained with the previous study (K. Tokuda et al. 2018), averaged within a circular aperture of radius 10″ centered at the same position. The black histogram shows the Total Power (TP) spectrum, while the blue histogram shows the ALMA 12 m array spectrum. Both spectra are displayed at a velocity resolution of 0.85 km s−1.
Other Images in This Article
Copyright and Terms & Conditions
© 2026. The Author(s). Published by the American Astronomical Society.