Image Details
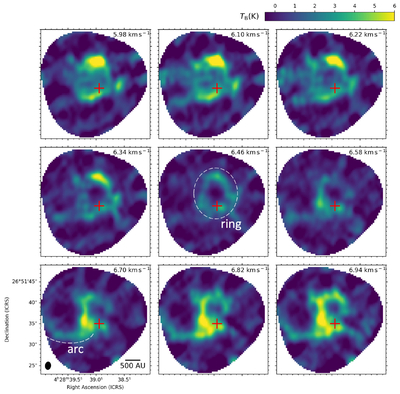
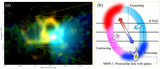
Caption: Figure 3.
Channel maps of the CO(J = 6–5) emission at the native spectral resolution (Δv = 0.12 km s−1), shown as a 3 × 3 panel. All panels are displayed in brightness temperature units (K). The central velocity channel is shown in the upper right corners of each panel in km s−1 units. The beam size of ﹩1\mathop{.}\limits{^{\prime\prime} }8\times 1\mathop{.}\limits{^{\prime\prime} }3﹩ (Position Angle ﹩=\,-6\mathop{.}\limits^{^\circ }1﹩) is shown in the ellipse at the lower left corner in the lower left panel. The red cross shows the position of the protostar.
Other Images in This Article
Copyright and Terms & Conditions
© 2026. The Author(s). Published by the American Astronomical Society.
Copyright ©
2026 Astronomy Image Explorer. All Rights Reserved.