Image Details
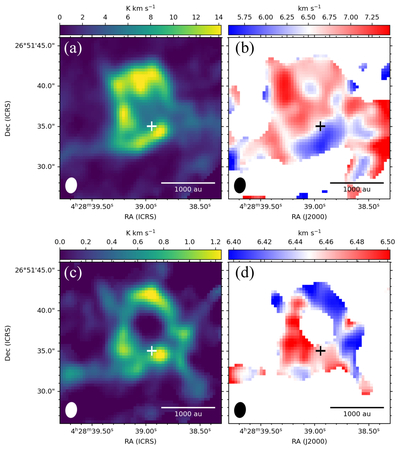
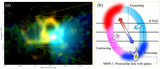
Caption: Figure 4.
(a) Integrated-intensity (moment 0) map of CO(J = 6–5) integrated over VLSRK = 4.4–8.6 km s−1. The beam size ellipse is shown in the lower left corner. The cross mark shows the protostar position. (b) Intensity-weighted mean velocity (moment 1) map computed over the same velocity range. (c) Same as panel (a), but for the integrated velocity range of VLSRK = 6.3–6.7 km s−1. (d) Same as panel (b), but the velocity range as same as in panel (c).
Other Images in This Article
Copyright and Terms & Conditions
© 2026. The Author(s). Published by the American Astronomical Society.
Copyright ©
2026 Astronomy Image Explorer. All Rights Reserved.