Image Details
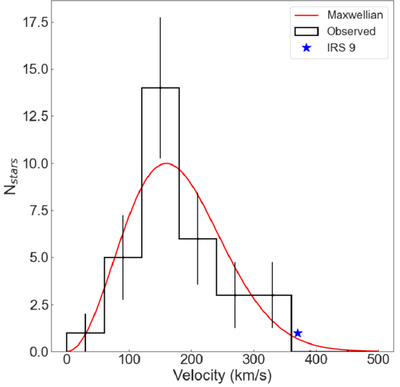
Caption: Figure 4.
The observed v3d distribution of 32 stars with projected radii within ±1″ of IRS 9 (black histogram), compared to the v3d of IRS 9 itself (blue star). The expected v3d distribution of the NSC is taken to be a Maxwellian distribution with a scale parameter equal to the velocity dispersion at this radius derived from a dynamical model of the NSC (S. Chatzopoulos et al. 2015; red line). From this distribution, we calculate that the probability of observing a star with a v3d greater than or equal to IRS 9 is ∼1%.
Other Images in This Article
Copyright and Terms & Conditions
© 2026. The Author(s). Published by the American Astronomical Society.
Copyright ©
2026 Astronomy Image Explorer. All Rights Reserved.