Image Details
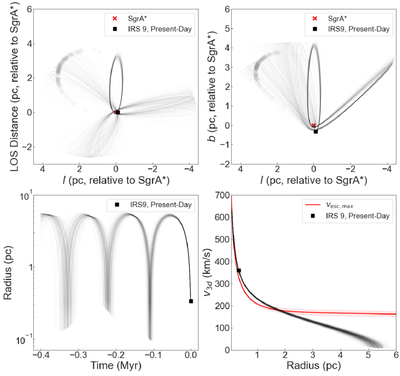
Caption: Figure 3.
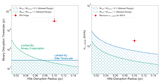
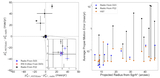
The orbit of IRS 9, integrated for the past 0.4 Myr and assuming dlos = 0 pc. In each panel, the black lines represent orbits drawn from a Monte Carlo simulation over the measured properties of IRS 9, and so the spread of lines reveals the uncertainty in the orbit. Top left: a “top-down” view of the orbit from the north Galactic pole (with Earth at negative line-of-sight distance). The filled black square represents the current position of IRS 9, while the faded black circles represent the end point of each orbit (i.e., 0.4 Myr in the past). SgrA* is represented by the red cross. Top right: an “edge-on” view of the orbit from the Galactic plane, constructed in the same manner as the top left panel. Bottom left: the distance of IRS 9 from SgrA* as a function of time. Bottom right: the v3d of IRS 9 as a function of radius, compared to ﹩{v}_{{\rm{esc}},{\rm{\max }}}﹩ (red line, with uncertainty shown as the shaded region). IRS 9 is locally unbound when v3d > ﹩{v}_{{\rm{esc}},{\rm{\max }}}﹩, as is the case at the present day (at r2d = 0.33 pc). However, the star is bound to the GC at larger radii as v3d drops below ﹩{v}_{{\rm{esc}},{\rm{\max }}}﹩.
Other Images in This Article
Copyright and Terms & Conditions
© 2026. The Author(s). Published by the American Astronomical Society.