Image Details
Caption: Figure 2.
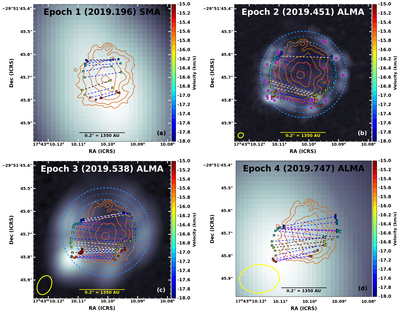
Native-resolution peak intensity images of the 217 GHz maser emission in grayscale, ordered by epoch, overlaid with 217 GHz continuum contours from Epoch 2019.538 (0.05, 0.1, 0.2, 0.4, and 0.8 Jy beam−1) and marked with the two-component fits as crosses colored by velocity and connected to their counterparts by dashed lines. The initial estimates are shown as magenta crosses in panel (b). Blue dashed lines denote channels fit successfully across all epochs and magenta dashed lines denote channels fit successfully across only the ALMA epochs, while white and black dashed lines denote the remaining channels fit successfully in two or fewer epochs. The blue circles in panels (b) and (c) are the circle fits (Section 3.3) for their epochs, with the dashed–dotted circle being the best fit and the dashed circles representing the 1σ uncertainties.
Other Images in This Article
Copyright and Terms & Conditions
© 2026. The Author(s). Published by the American Astronomical Society.