Image Details
Caption: Figure 3.
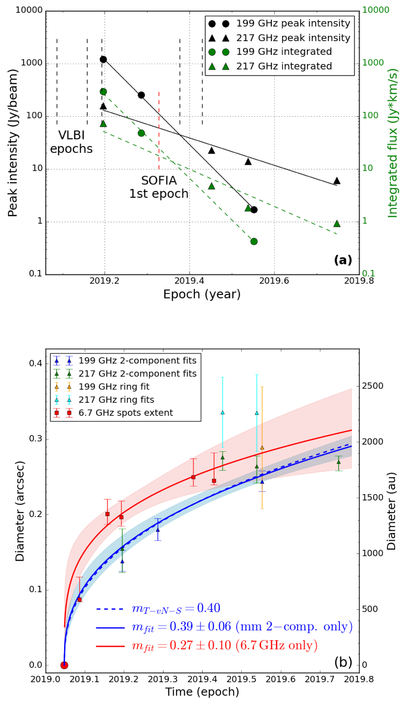
(a) Light curve of the 199 and 217 GHz maser lines on a semilog scale overlaid by fitted models of exponential decay, with vertical dashed lines denoting the VLBI epochs (R. A. Burns et al. 2020) and first SOFIA epoch (B. Stecklum et al. 2021) for reference; (b) ring diameter versus time as inferred from the various maser tracers and methods described in Section 3.3. The solid curves are fractional power-law fits to the millimeter maser two-component fit results from this work (blue) and independently to the 6.7 GHz VLBI measurements (red) from R. A. Burns et al. (2023). The best-fit blue solid curve is consistent with the Taylor–von Neumann–Sedov exponent (blue dashed curve) within the 90% confidence region indicated by the blue shaded area computed from bootstrap analysis (see Section 3.4). The red spot marks the inception of the maser flare (K. Sugiyama et al. 2019). The gap in the red curve near the origin is where the fit would exceed the speed of light.
Other Images in This Article
Copyright and Terms & Conditions
© 2026. The Author(s). Published by the American Astronomical Society.