Image Details
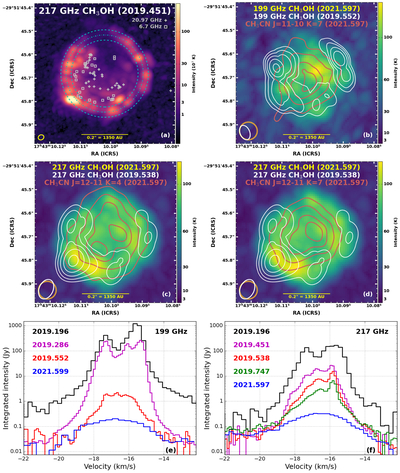
Caption: Figure 1.
(a) Peak intensity image of the 217 GHz masers surrounding MM1 at Epoch 2019.451, with squares marking 6.7 GHz maser spots at Epoch 2019.429 from R. A. Burns et al. (2023) and plus signs marking 20.9706 GHz maser spots at Epoch 2019.421 from O. S. Bayandina et al. (2022). The blue dashed–dotted circle is a fit to the Gaussian-fitted positions of the eight strongest spatial components around the ring, while the dashed circles represent the 1σ uncertainty on the fit. Panels (b)–(d) show in color scale the peak intensity of the 199 GHz (b) and 217 GHz ((c), (d)) CH3OH transitions, smoothed to ﹩0\mathop{.}\limits^{^{\prime\prime} }075﹩ resolution, from the 2021.60 epoch data when the emission is consistent with thermal excitation. White contours show the peak intensity of the 199 GHz (b) and 217 GHz (c), (d) CH3OH lines while they were still strongly masing circa 2019.5 (levels: 5%, 10%, 20%, 40%, and 80% of the maser peak). Also overlaid on (b)–(d) are red contours of the CH3CN integrated intensity, smoothed to ﹩0\mathop{.}\limits^{^{\prime\prime} }075﹩ resolution, for the J = 11–10, K = 7; J = 12–11, K = 4; and J = 12–11, K = 7 transitions, respectively (levels: 25%, 50%, 75%, and 90% of the peak). Panels (e)–(f) show spectra of the central 10 km s−1 spatially integrated over the region of significant emission at each of the epochs from Table 1.
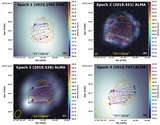
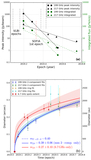
Other Images in This Article
Copyright and Terms & Conditions
© 2026. The Author(s). Published by the American Astronomical Society.