Image Details
Caption: Figure 4.
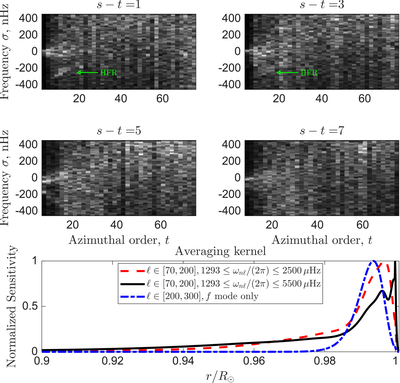
Vorticity spectra obtained using only f-modes in the range ℓ ∈ [200, 300] and 1293 ≤ ωnℓ/(2π) ≤ 5500 μHz. The upper four panels show only the HFR mode, and extended prograde ridges are absent. Interestingly, ridge U is visible in the s − t = 1 plot. Shown in the lowest panel is a comparison between the effective depth sensitivities of the mode averages we use to produce Figures 1, 2, and the f-mode spectra (upper two rows of this figure). We obtain these figures by computing the sensitivity kernels associated with each mode used in the analysis and performing an alternating sum over them. Each effective averaging kernel has a different amplitude, and we normalize them so as to facilitate direct comparison across the mode sets. The averaging kernels sample the interior differently. As expected, the lower-frequency set of modes senses deeper layers, whereas the higher-frequency average is more strongly peaked in the surface layers. The f-mode average (blue dashed line) peaks just below the surface and is insensitive to the deeper layers. This suggests that the dominant fraction of the thermal Rossby signal may be emerging from layers r/R⊙ < 0.98 or ∼13 Mm below the surface.
Other Images in This Article
Copyright and Terms & Conditions
© 2026. The Author(s). Published by the American Astronomical Society.