Image Details
Caption: Figure 1.
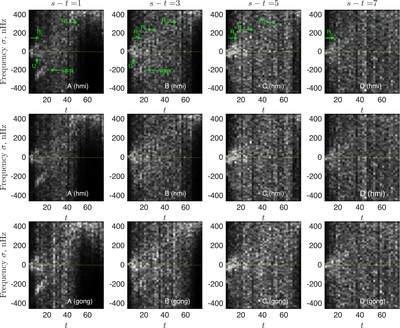
Power spectra of vortical motions obtained using modes in the range ℓ ∈ [70, 200] and 1293 ≤ ωnℓ/(2π) ≤ 5500 μHz. A uniform tracking rate of Ω⊙/(2π) = 456 nHz was applied to retrieve these measurements. Vertical axes denote temporal frequency (nHz), and horizontal axes are azimuthal orders at fixed s − t (stated in the title of the uppermost panels). Arrows direct the attention of the reader to the following features: the previously detected high-frequency retrograde ridge (marked as HFR; C. S. Hanson et al. 2022); one prograde feature; and one marked by green arrows and labeled R1, whose dispersion relation is given by σ1 = −0.0093t2 + 5.855t − 7.419 nHz (marked as green dots in the uppermost panels). A faint higher-frequency prograde ridge, parallel to R1, is seen over the azimuthal-order range t ∈ [30, 60]; we do not point it out because the signal-to-noise ratio is marginal. Some features are repeated in independent channels, i.e., at different values of s − t. A previously undetected ridge starting at zero frequency and becoming increasingly retrograde (marked as U) is also visible in the proximity of the HFR feature. This may be an Alfvén–Rossby wave although further considerations are beyond the scope of this Letter. The first row is annotated in order to draw the attention of the reader to the features; the latter two rows show the spectra with no markings. The raw spectra are averaged in temporal frequency using a 21.4 nHz boxcar filter. The horizontal yellow line marks zero temporal frequency; features above this are prograde and below it are retrograde. There are indications of a richer spectrum of ridges although these will be pursued in a future effort.
Other Images in This Article
Copyright and Terms & Conditions
© 2026. The Author(s). Published by the American Astronomical Society.