Image Details
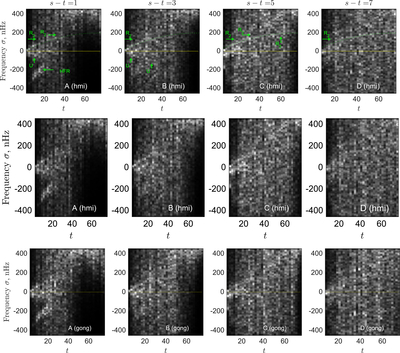
Caption: Figure 2.
Power spectra of vortical motions obtained using modes in the range ℓ ∈ [70, 200] and 1293 ≤ ωnℓ/(2π) ≤ 2500 μHz, a smaller mode-frequency range than used to produce the plots in Figure 1. The depth sensitivity of this mode sum is different from that of Figure 1, as shown in the lowest panel of Figure 4. A uniform tracking rate of Ω⊙/(2π) = 456 nHz was applied to retrieve these measurements. Vertical axes denote temporal frequency (nHz), and horizontal axes are azimuthal orders at fixed s − t (stated in the title). Arrows direct the attention of the reader to the following features: the previously detected high-frequency retrograde feature (marked as HFR; C. S. Hanson et al. 2022) and the retrograde ridge U identified in Figure 1, which is less prominently visible here. A new prograde branch, different from the mode seen in Figure 1, is denoted as R2 and described by the dispersion relation σ2 = −0.0379t2 + 5.45t − 0.0776 nHz (marked as green dots in the uppermost panels). Unlike R1, which is seen to be steadily increasing with wavenumber, R2 appears to saturate at ∼210 nHz. Some features are repeated in independent channels, i.e., at different values of s − t. The first row is annotated in order to draw the attention of the reader to the features; the latter two rows show the spectra with no markings. The raw spectra are averaged in temporal frequency using a 21.4 nHz boxcar filter. The horizontal yellow line marks zero temporal frequency; features above this are prograde and below it are retrograde. There are indications of a richer spectrum of ridges although these will be pursued in a future effort.
Other Images in This Article
Copyright and Terms & Conditions
© 2026. The Author(s). Published by the American Astronomical Society.