Image Details
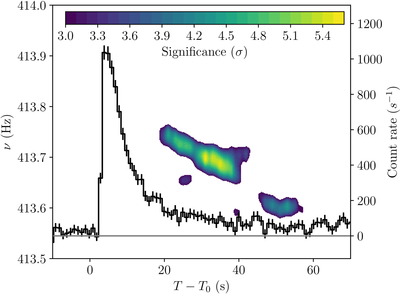
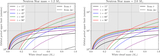
Caption: Figure 3.
Significance contours of the oscillations as a function of time and frequency (left-hand axis), computed using a ﹩{Z}_{1}^{2}﹩ test in a 20 s sliding window with 1 s steps. Significance levels are given as a color gradient. The burst lightcurve is shown as the equivalent on-axis count rate (right-hand axis) in the 4–40 keV energy band, with the persistent emission subtracted, binned in 1 s intervals.
Other Images in This Article
Copyright and Terms & Conditions
© 2026. The Author(s). Published by the American Astronomical Society.
Copyright ©
2026 Astronomy Image Explorer. All Rights Reserved.