Image Details
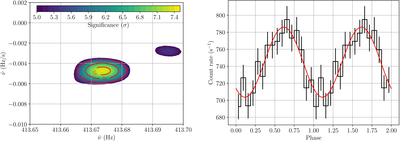
Caption: Figure 4.
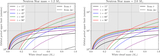
Left: significance contours in the ﹩\bar{\nu }﹩–﹩\dot{\nu }﹩ plane for the time window yielding the most significant signal [T0+11 s, T0+62 s]. Significance levels are given as a color gradient. Overlaid in red are the contours of a two-dimensional Gaussian fitted around the peak. The best-fit parameters, ﹩\bar{\nu }=413.674﹩ Hz and ﹩\dot{\nu }=-4.7\times 1{0}^{-3}﹩ Hz s−1, are used to fold the lightcurve in this interval. Right: folded burst profile using the fitted parameters over the selected time window, in black. The best-fit sinusoidal model to the profile is shown in red.
Other Images in This Article
Copyright and Terms & Conditions
© 2026. The Author(s). Published by the American Astronomical Society.
Copyright ©
2026 Astronomy Image Explorer. All Rights Reserved.