Image Details
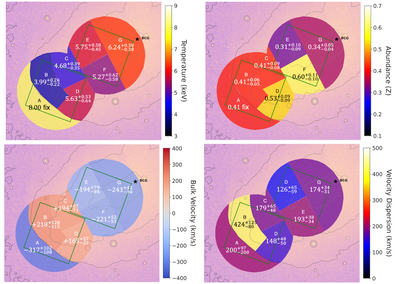
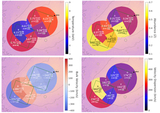
Caption: Figure 3.
Maps of temperature (top left), abundance (top right), LoS bulk velocity relative to the BCG (bottom left), and LoS velocity dispersion (bottom right) for the sky regions defined in Figure 1. The black star indicates the position of the BCG. Contours represent the X-ray surface brightness from the Chandra image. The green boxes indicate regions covered by the XRISM/Resolve observations.
Other Images in This Article
Copyright and Terms & Conditions
© 2025. The Author(s). Published by the American Astronomical Society.
Copyright ©
2025 Astronomy Image Explorer. All Rights Reserved.