Image Details
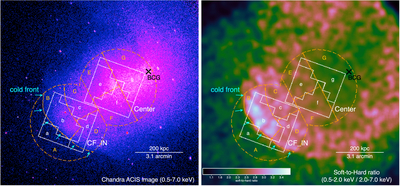
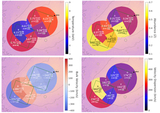
Caption: Figure 1.
(Top) Chandra image of A3667 in the 0.5–7.0 keV band. White squares show the fields of view of the two XRISM/Resolve observations. White pixellated subregions within the white squares represent detector regions used for spectral extraction. The dashed orange regions represent the sky regions for which the ICM parameters are derived. A black “x” marks the position of the BCG, and cyan arrows indicate the prominent cold front seen in the Chandra image. (Bottom) Soft-to-hard ratio map of A3667, constructed from the ratio of the 0.5–2.0 to 2.0–7.0 keV Chandra images. This map shows spatial variations of the ICM temperature, with brighter regions corresponding to cooler gas.
Other Images in This Article
Copyright and Terms & Conditions
© 2025. The Author(s). Published by the American Astronomical Society.