Image Details
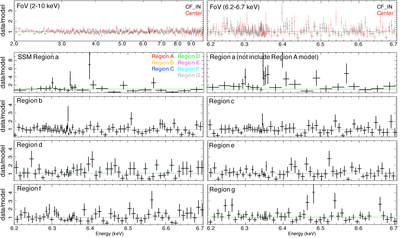
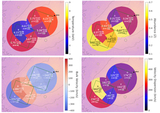
Caption: Figure 6.
Data-to-model ratio plots corresponding to the spectral fits shown in Figure 2. Alt text: Ten line graphs. In the upper left panel, the x-axis shows the energy from 2.0 to 10.0 keV. The y-axis shows the data-to-model ratio from 0 to 4. In the upper right panel, the x-axis shows the energy from 6.2 to 6.7 keV. The y-axis shows the data-to-model ratio from 0 to 4. In the second row of panels, the x-axis shows the energy from 6.2 to 6.7 keV. The y-axis shows the data-to-model ratio from 0 to 10. In the bottom panels, the x-axis shows the energy from 6.2 to 6.7 keV. The y-axis shows the data-to-model ratio from 0 to 5.
Other Images in This Article
Copyright and Terms & Conditions
© 2025. The Author(s). Published by the American Astronomical Society.