Image Details
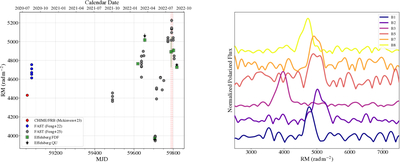
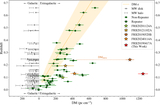
Caption: Figure 6.
Left: the RM evolution of FRB 20190417A. Previous RM measurements are taken from Y. Feng et al. (2022; blue circles), R. Mckinven et al. (2023; red circle) and Y. Feng et al. (2025; gray circles). The green squares indicate RM measurements obtained using a brute-force search to maximize linear polarization. The error bars are calculated as FWHM/(S/N) of the brightest peak in the FDF. The black stars indicate the RM measurements obtained from a QU-fit for the bursts that were sufficiently bright. Vertical dashed lines indicate the MJDs of B4 and B6 that had too low S/N to obtain an RM measurement. Right: FDFs of the FRB 20190417A bursts detected with Ef. The instrumental delay has already been accounted for, so the shift in the peak indicates significant variation in the RM of the source.
Other Images in This Article
Copyright and Terms & Conditions
© 2025. The Author(s). Published by the American Astronomical Society.