Image Details
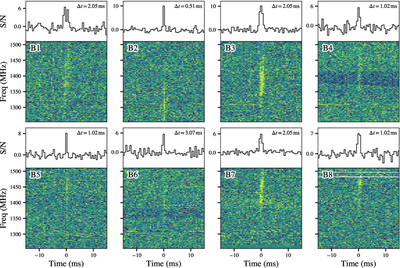
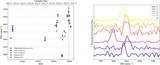
Caption: Figure 5.
Temporal profiles (top) and dynamic spectra (bottom) of the eight FRB 20190417A bursts detected with the Ef radio telescope. Each burst is coherently dedispersed to a DM of 1379.0 pc cm−3 and is shown with a frequency resolution of 1 MHz; the time resolutions are shown in the upper right corners of each panel. Horizontal white bands correspond to frequency channels that have been flagged owing to RFI. The limits of the color map have been set to the 20th and 98th percentiles of each dynamic spectrum. We note that some of the wider bursts appear slightly over-dedispersed; future work will analyze all bursts at a higher time resolution to place tighter constraints on their DM.
Other Images in This Article
Copyright and Terms & Conditions
© 2025. The Author(s). Published by the American Astronomical Society.