Image Details
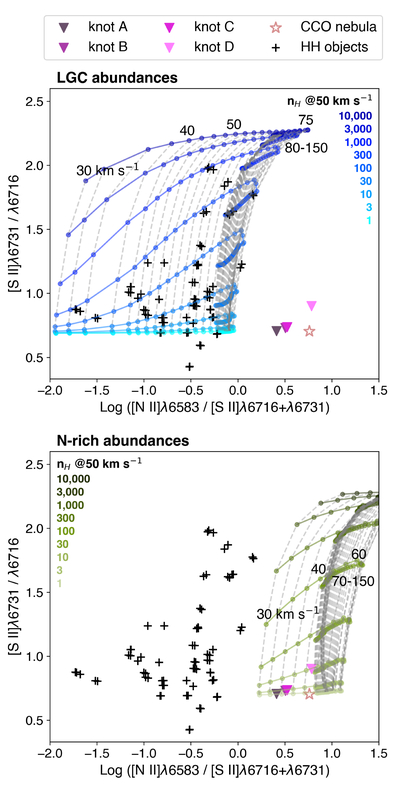
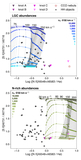
Caption: Figure 5.
Line-ratio diagnostic diagram of [S II]λ6716 / λ6731 versus [N II]λ6583/[S II]λ6716+λ6731, comparing MUSE measurements with the slow-shock model prediction, computed with LGC abundances in blue lines (top) and nitrogen-rich (WN-like) abundances from J. Suherli et al. (2024) in green lines (bottom). Each panel shows the predicted values for shock velocities of 30–150 km s−1 and preshock hydrogen densities spanning nH = 1–104 cm−3. Black “+” symbols mark the classical HH objects from (A. C. Raga et al. 1996), and the inverted colored triangles represent HH knots A–D of Ve 7–27 (as labeled in Figure 2). The hollow the red star denotes the CCO nebula; it is shown only for reference, as its emission is thought to arise from photoionization rather than shocks.
Other Images in This Article
Copyright and Terms & Conditions
© 2026. The Author(s). Published by the American Astronomical Society.