Image Details
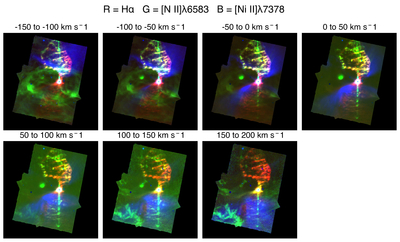
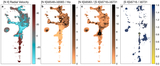
Caption: Figure 6.
Channel maps of Hα (red), [N II]6583 (green), and [Ni II]7378 (blue) emission from the continuum-subtracted MUSE datacube, from −150 to +200 km s−1. Each panel shows the integrated intensity within a fixed velocity slice indicated in the label. The red square marks the CCO nebula.
Other Images in This Article
Copyright and Terms & Conditions
© 2026. The Author(s). Published by the American Astronomical Society.
Copyright ©
2026 Astronomy Image Explorer. All Rights Reserved.