Image Details
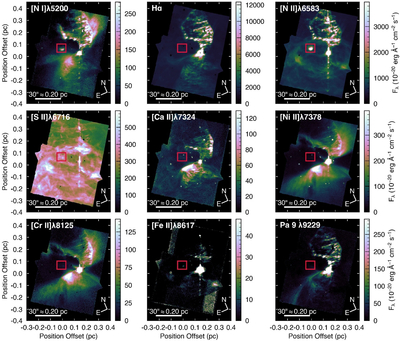
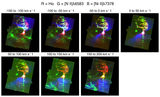
Caption: Figure 3.
Continuum-subtracted MUSE narrowband images constructed by integrating each line over the velocity range −150 to +200 km s−1. Top row: [N I]λ5200, Hα, and [N II]λ6583 line emissions. Middle row: [S II]λ6716, [Ca II]λ7324, and [Ni II]λ7378. Bottom row [Cr II]λ8125, [Fe II]λ8617, and Pa 9 λ9229. The red square in each panel marks the position of Vela Jr CCO nebula.
Other Images in This Article
Copyright and Terms & Conditions
© 2026. The Author(s). Published by the American Astronomical Society.
Copyright ©
2026 Astronomy Image Explorer. All Rights Reserved.