Image Details
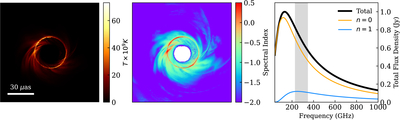
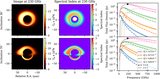
Caption: Figure 5.
Spectral feature in ray-traced GRMHD, corresponding to a MAD a = 0.5 Rhigh = 160 model of M87*. Left: total intensity map. Center: spectral index map at 230 GHz revealing the elevated spectral index in the photon ring. Right: instantaneous spectrum, where the gray vertical band demarcates 230–345 GHz, and a circle marks the maximum of each contribution.
Other Images in This Article
Copyright and Terms & Conditions
© 2025. The Author(s). Published by the American Astronomical Society.
Copyright ©
2025 Astronomy Image Explorer. All Rights Reserved.