Image Details
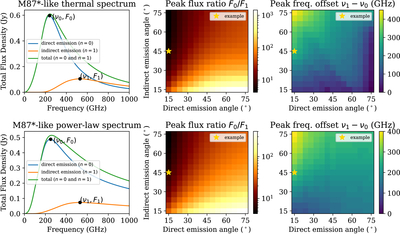
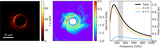
Caption: Figure 2.
Spectroscopy of the photon ring as predicted by a one-zone model viewed from two angles, tuned to approximate the size and compact flux of the M87* accretion flow. Top row: thermal electron energy distribution with Θe = 10 and ne = 3 × 104 cm−3. Bottom row: power-law electron energy distribution with ﹩p=3,{\gamma }_{min}=100,{\gamma }_{max}=\rm{10,000}﹩, and ne = 5 × 102cm−3. Both models have B = 30 G. Left: an example spectrum from the model chosen to accentuate the effect, for which the n = 1 image contributes a prominent spectral flattening beyond the turnover frequency. Middle: the range of ratios between the spectral peaks of each subimage as a function of the emission angles in each image. Right: same as the middle, but for the frequency offset between the peaks.
Other Images in This Article
Copyright and Terms & Conditions
© 2025. The Author(s). Published by the American Astronomical Society.