Image Details
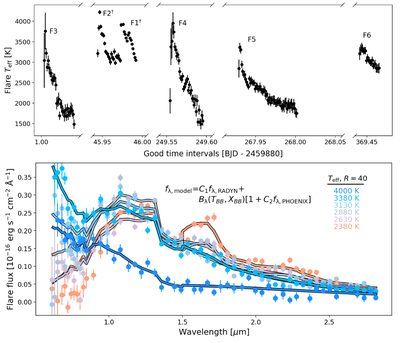
Caption: Figure B2.
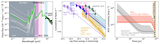
Top: flare Teff time series for all 189 integrations in our GTI sample. Bottom: combined RADYN and quiescent fits for a range of fiducial flare temperatures. We note the addition of the PHOENIX component is not intended to claim these features are physically correlated with the RADYN continuum, only that the combined fit better describes the flare spectrum when quiescent bleed-through is present.
Other Images in This Article
Copyright and Terms & Conditions
© 2025. The Author(s). Published by the American Astronomical Society.
Copyright ©
2025 Astronomy Image Explorer. All Rights Reserved.