Image Details
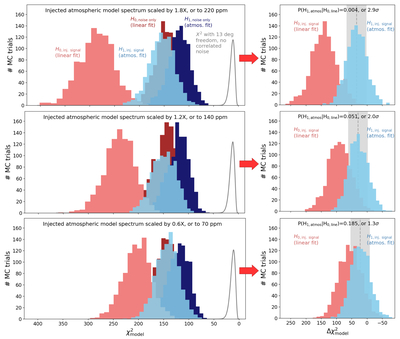
Caption: Figure 6.
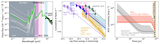
Illustration of transmission spectrum injection and recovery testing procedure using measured χ2 (left panels) and Δχ2 (right panels) distributions. The J. Lustig-Yaeger et al. (2019) TRAPPIST-1b 10 bar CO2 atmospheric transmission spectrum is scaled by 0.6, 1.2, and 1.8 times and injected into the precorrection spectrum of all integrations. Bootstrapped χ2 values are recorded for linear and model atmosphere fits to the detrended mean flare spectrum under four scenarios: (i) a linear model fit to the spectrum with the injected signal; (ii) an atmosphere model fit to the spectrum with the injected signal; (iii) a linear model fit to the spectrum in the absence of any injected signals; and (iv) an atmospheric model fit to the spectrum in the absence of any injected signals. The presence of correlated noise in the no-atmosphere samples is highlighted by comparison to the random-variable χ2 function with the same 13 degrees of freedom. Hypothesis tests for atmosphere versus linear fits are therefore computed using Δχ2 distributions where the correlated noise baselines have been subtracted.
Other Images in This Article
Copyright and Terms & Conditions
© 2025. The Author(s). Published by the American Astronomical Society.