Image Details
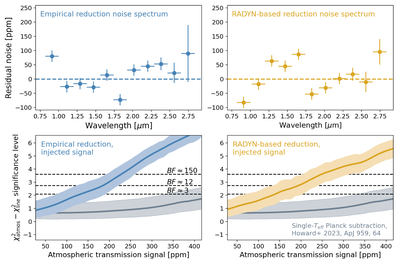
Caption: Figure 5.
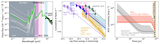
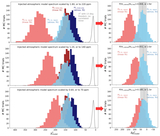
Top: residual flare contamination of 60–140 ppm in the R = 10 average detrended spectrum of all 189 integrations following application of the empirical (left, blue) and RADYN-model-based (gold, right) pipelines. Bottom: detection significance versus transmission signal strength for the detrended spectra, derived from injection and recovery tests of J. Lustig-Yaeger et al. (2019) CO2 atmospheric transmission signals scaled from 12 to 480 ppm. The estimated BFs of 3, 12, and 150 represent “weak,” “moderate,” and “strong” detections (R. Trotta 2008), respectively. The detection significance curve using the simple Planck fit approach from W. S. Howard et al. (2023) is shown for reference (gray).
Other Images in This Article
Copyright and Terms & Conditions
© 2025. The Author(s). Published by the American Astronomical Society.