Image Details
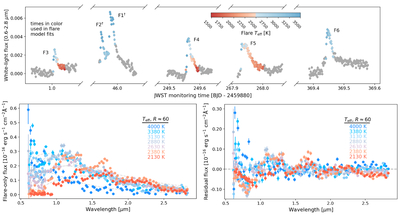
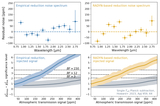
Caption: Figure 1.
Top: the wavelength-integrated (0.6–2.83 μm) transit-normalized flare light curves of our sample. The flare temperatures of the integrations used for model validation and mitigation are scaled by color. Bottom left: fiducial Teff flare spectra are computed from similar-temperature integrations. Best-fitting blackbody curves are shown with the dashed gray lines. Bottom right: quiescent features appear in the residual spectra after subtracting the best-fit blackbody curves.
Other Images in This Article
Copyright and Terms & Conditions
© 2025. The Author(s). Published by the American Astronomical Society.
Copyright ©
2025 Astronomy Image Explorer. All Rights Reserved.