Image Details
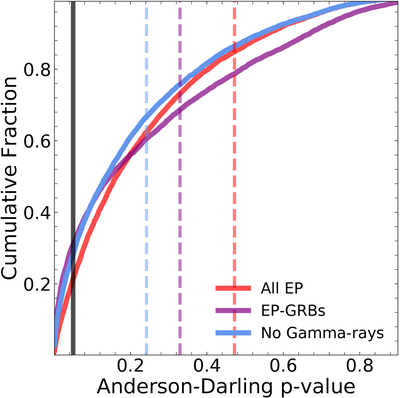
Caption: Figure C2.
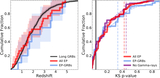
Cumulative distribution of AD p-values obtained from bootstrapping. We show the p-value distributions for all EP transients (red), EP-GRBs (blue), and those without prompt gamma-ray detections (purple). The vertical lines show the p-value for the measured sample without any bootstrapping. The solid black line denotes p = 0.05, below which the null hypothesis is rejected.
Other Images in This Article
Copyright and Terms & Conditions
© 2025. The Author(s). Published by the American Astronomical Society.
Copyright ©
2025 Astronomy Image Explorer. All Rights Reserved.