Image Details
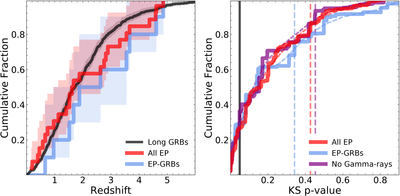
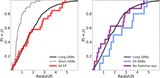
Caption: Figure C1.
Left: cumulative distribution of the redshift of EP transients (red) compared to EP-GRBs (blue) and long GRBs (black). The shaded regions show the 90% confidence regions of the CDFs after bootstrapping N = 10,000 times. To avoid further crowding the figure, we do not display the EP subsample without gamma rays. Right: cumulative distribution of KS p-values obtained from bootstrapping. We show the p-value distributions for all EP transients (red), EP-GRBs (blue), and those without prompt gamma-ray detections (purple). The thin-line CDFs are computed when also bootstrapping the long GRB distribution, whereas the thick solid lines are determined when only bootstrapping the three EP distributions. The vertical lines show the p-value for the measured sample without any bootstrapping. The solid black line denotes p = 0.05, below which the null hypothesis is rejected.
Other Images in This Article
Copyright and Terms & Conditions
© 2025. The Author(s). Published by the American Astronomical Society.