Image Details
Caption: Figure 1.
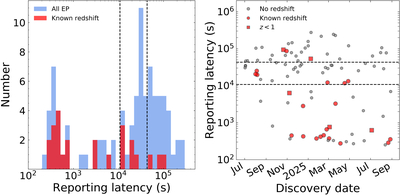
Left: histogram of the EP reporting latency measured as the time between GCN notice and EP trigger time. All EP transients (from 2024 July onward) are shown in blue, and those with measured redshifts are marked in red. The dashed lines mark 3 and 12 hr from the EP trigger. Right: reporting latency versus discovery date for EP transients. Those with no redshift are marked in gray, and those with redshifts are marked in red. Sources with redshift at z < 1 are shown by squares.
Other Images in This Article
Copyright and Terms & Conditions
© 2025. The Author(s). Published by the American Astronomical Society.
Copyright ©
2025 Astronomy Image Explorer. All Rights Reserved.