Image Details
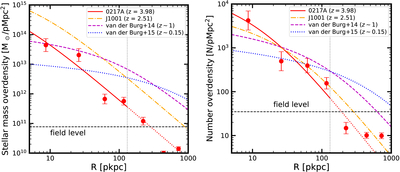
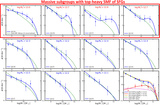
Caption: Figure 5.
The stellar mass and number density profile of 0217A: the left panel shows the projected stellar mass density profile, while the right panel shows the projected number density profile. The surface overdensities of 0217A are shown as the red lines, which have been subtracted by the field level (estimated as the density of field galaxies at 3.73 < z < 4.23 in PRIMER-COSMOS). For comparison, the orange dashed–dotted lines show the density profile of cluster J1001 at z = 2.51 (H. Sun et al. 2024), the purple dashed lines show the result of the GCLASS clusters at z ∼ 1 (R. F. J. van der Burg et al. 2014), and the blue dotted lines show the results of local clusters at z ∼ 0.15 (R. F. J. van der Burg et al. 2015). All of these archival results have been corrected to the density down to M* = 108.5M⊙ using their total SMF.
Other Images in This Article
Copyright and Terms & Conditions
© 2025. The Author(s). Published by the American Astronomical Society.